Retention and expansion overviews
Read the Retention and Expansion overviews — who is slipping, who is growing, and how each activation cohort holds up over time.
Retention and Expansion are the two stages in the Lifecycle sidebar that watch the whole active population rather than a set of steps. Retention shows who is at risk of leaving; Expansion shows who has grown and who is about to. Neither has steps or an end; a profile keeps being retained until it is not.
Both pages share one control, the window — 30, 90, 180 or 365 days. On an overview the window applies to events — activations, churns, expansions — rather than to when profiles signed up, because an overview watches the active population as it is today.
Both pages also ask the same two questions, in the same shape: how much is this profile worth to us, across, and how likely is this stage's outcome, up. Which score answers each is fixed — see Where a model is drawn — so a quadrant means the same thing on every page you meet it.
Every member can read both overviews. The scores behind them are edited under Settings → Scoring — see Tuning scoring models.
Retention
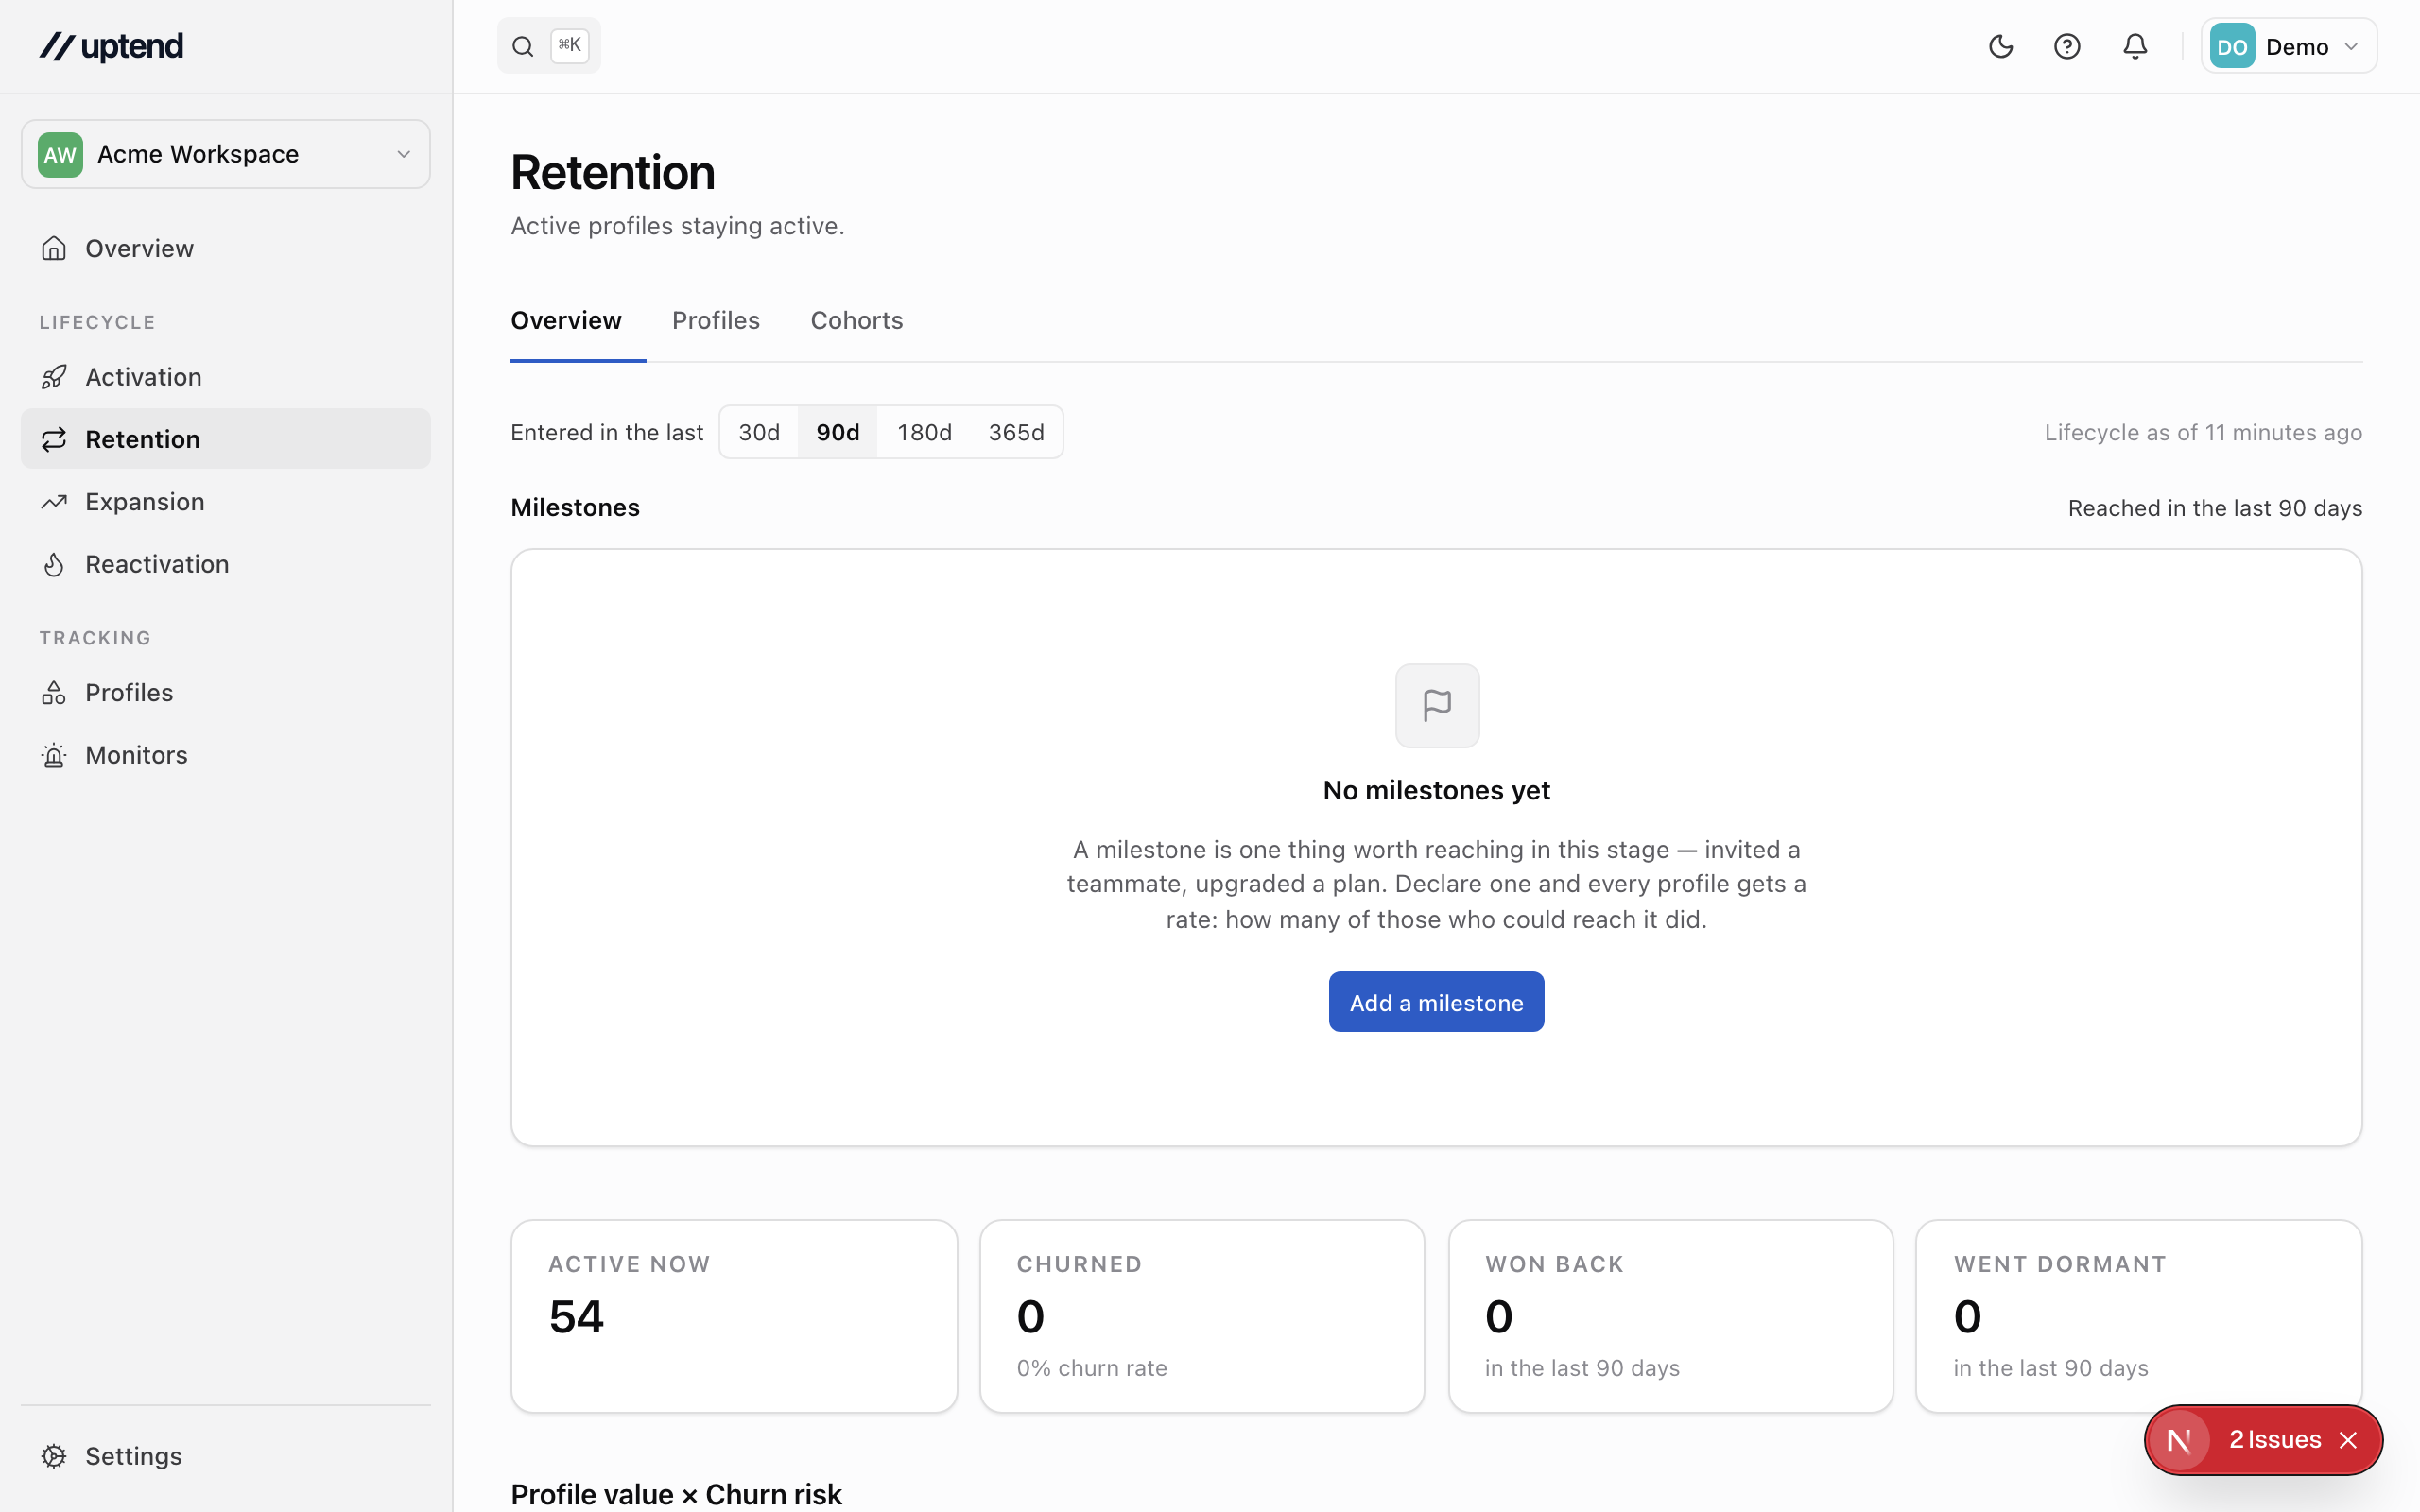
The tiles at the top are the active population right now, how many profiles churned in the window with the churn rate that implies, how many were won back, and how many profiles went dormant.
Retention by activation cohort
This one is not on the Overview: it is the Cohorts tab beside it, where every stage keeps the same table.
Profiles are grouped by the week they became active, and each cell is the share of that group still active one, two, four, eight and twelve weeks later. Retention is the only stage whose cells read that way round — everywhere else the cell is how many had reached the outcome by then, and Retention has no outcome to reach, so it counts who has not left. A cell stays blank until the cohort is old enough, so the table fills in from the top-left as time passes.
History starts here marks cohorts that activated before your first data source was connected. Uptend never watched those profiles, so it cannot see a churn that happened between their activation and the connection; the rows inside read flatter than the truth. Treat it as a floor on what really happened, not a measurement.
Value × risk
A four-cell grid over Profile value across and Churn risk up, with the high × high corner emphasised: large and at risk is who to call first. Profiles missing either score sit in the Unscored bucket rather than in a corner. With Profiles differ in worth switched off the grid disappears and the list below is the whole answer.
At risk
The same population, ranked: Churn risk first, then Profile value, so a large profile at risk sits above a small one. The third column is the two factors that contributed most to the risk number — "last_seen_at 12 days ago", or a plan downgrade — so the row says not just who is at risk but what is driving it. Click a row to open the profile. Profiles with Not enough data or Not computed sort after the numbers, never as zero.
Transitions
Who churned, was won back, or went dormant inside the window, newest first, each with the state it moved from and to. Activations are not listed here; they belong to the Activation stage.
Expansion
Expansion is the one stage whose outcome you define. Until you have declared a milestone on it — a plan ladder, a seat count — the page has nothing to measure and the Milestones list at the top says so. If expansion is not a concept in your product at all, switch it off and the stage leaves the sidebar.
lifecycle-expansion-overviewThe tiles
- Expansion rate — of the profiles that could have grown in the window, how many did. The denominator is eligibility, not population: a profile Uptend has no reading for yet has nowhere measurable to go and is left out, because counting it would turn the rate into a statement about your property mapping.
- Expansions — how many moves up were recorded in the window.
- Net moves — expansions minus contractions, with the number of downgrades underneath.
- Active now — the population the page is about.
By milestone
The per-milestone rates are the Milestones list at the top of the page — one row per kind of growth you track, each with its own rate, its own denominator and how long growing took. Tracking "free to paid" and "pro to enterprise" as separate milestones is the point: they have different denominators and usually different owners. See Milestones.
Recent moves
Every expansion and contraction in the window, newest first, with the values it moved between. A move is noticed by the next evaluation rather than at the moment it happened, so its time reads "around" a date. The same rows appear on the profile's timeline.
Who is next
The quadrant and the list under it: Expansion readiness up against Profile value across, over every active profile. This is the prediction; everything above it is the record. Readiness reads how close each profile is to its next rung — nine seats of ten, one tier below the top — so the list is who to talk to, and the rates above are how often that conversation has worked.
The scores behind both overviews
Every active profile carries four profile-level scores, computed by the scoring pass after each evaluation: ICP fit, Profile value, Churn risk and Expansion readiness. Risk and readiness are computed only while a profile is Active; when it churns, those two are cleared rather than left to read as live numbers on a dead profile. Fit and value are kept, so the overviews can still say how big the profiles you lost were.
Every score names the factors that produced it, and a profile too thin to score fairly reads Not enough data with the missing inputs listed. The models arrive reading placeholder property keys — company_size, plan, users_total, projects_total, last_seen_at — so a profile whose source does not carry those keys reads Not enough data until the keys are mapped (users_total and projects_total come from the usage metrics the Usage page suggests) or the model's factors are pointed at the properties you have under Settings → Scoring.