Lifecycle overview
How Uptend places every profile in one of four states, and how the four stages in the sidebar move them between those states.
The Lifecycle section of the workspace sidebar is where you see how your profiles are doing. It has four stage entries — Activation, Retention, Expansion and Reactivation — and it never grows beyond those, however many milestones and monitors you set up. Every stage works the same way. It can get shorter: a product with a single tier switches expansion tracking off and the Expansion entry goes with it.
Every member of the workspace can read the Lifecycle pages. Editing the lifecycle definition, monitors and scoring models is limited to workspace admins.
States
Every profile is in exactly one lifecycle state at a time:
| State | Meaning |
|---|---|
| New | Signed up, not yet activated. |
| Dormant | Stayed new for too long without activating (30 days by default). |
| Active | Crossed your activation threshold, or came back after churning. |
| Churned | Was active, then went quiet for longer than the grace period (14 days). |
Activated is a milestone, not a state: it happens once, at a moment, and that moment anchors the cohort views. A profile that churns and comes back is simply Active again, with a count of how many times it has been won back.
Which rules decide these states, and how the timers work, is set under Settings → Lifecycle — see Defining the lifecycle.
Stages
Each stage is a motion over a population of profiles:
| Stage | Who is in it | When they entered | What counts as getting there |
|---|---|---|---|
| Activation | New profiles | They signed up | They activated |
| Retention | Active profiles | They became active | Nothing — see below |
| Expansion | Active profiles you can measure growth on | They became measurable | They grew a rung |
| Reactivation | Churned and dormant | They left | They came back |
Every stage has a conversion rate: of the profiles that entered it in the window, how many reached its outcome. Retention is the one with no rate, and rightly — a profile keeps being retained until it is not, so there is no moment to count. Its cohorts read the other way instead: how many of each cohort are still active.
Expansion's population is narrower than Retention's even though both are active profiles: a profile only counts once one of the stage's milestones has a reading for it, because a profile with nowhere measurable to go cannot be measured growing.
If a profile leaves and comes back and leaves again, it belongs to the cohort of its most recent entry, and what is measured is whether that attempt worked.
How a stage page is laid out
Every stage page has one row of tabs, picking how you are looking at the stage:
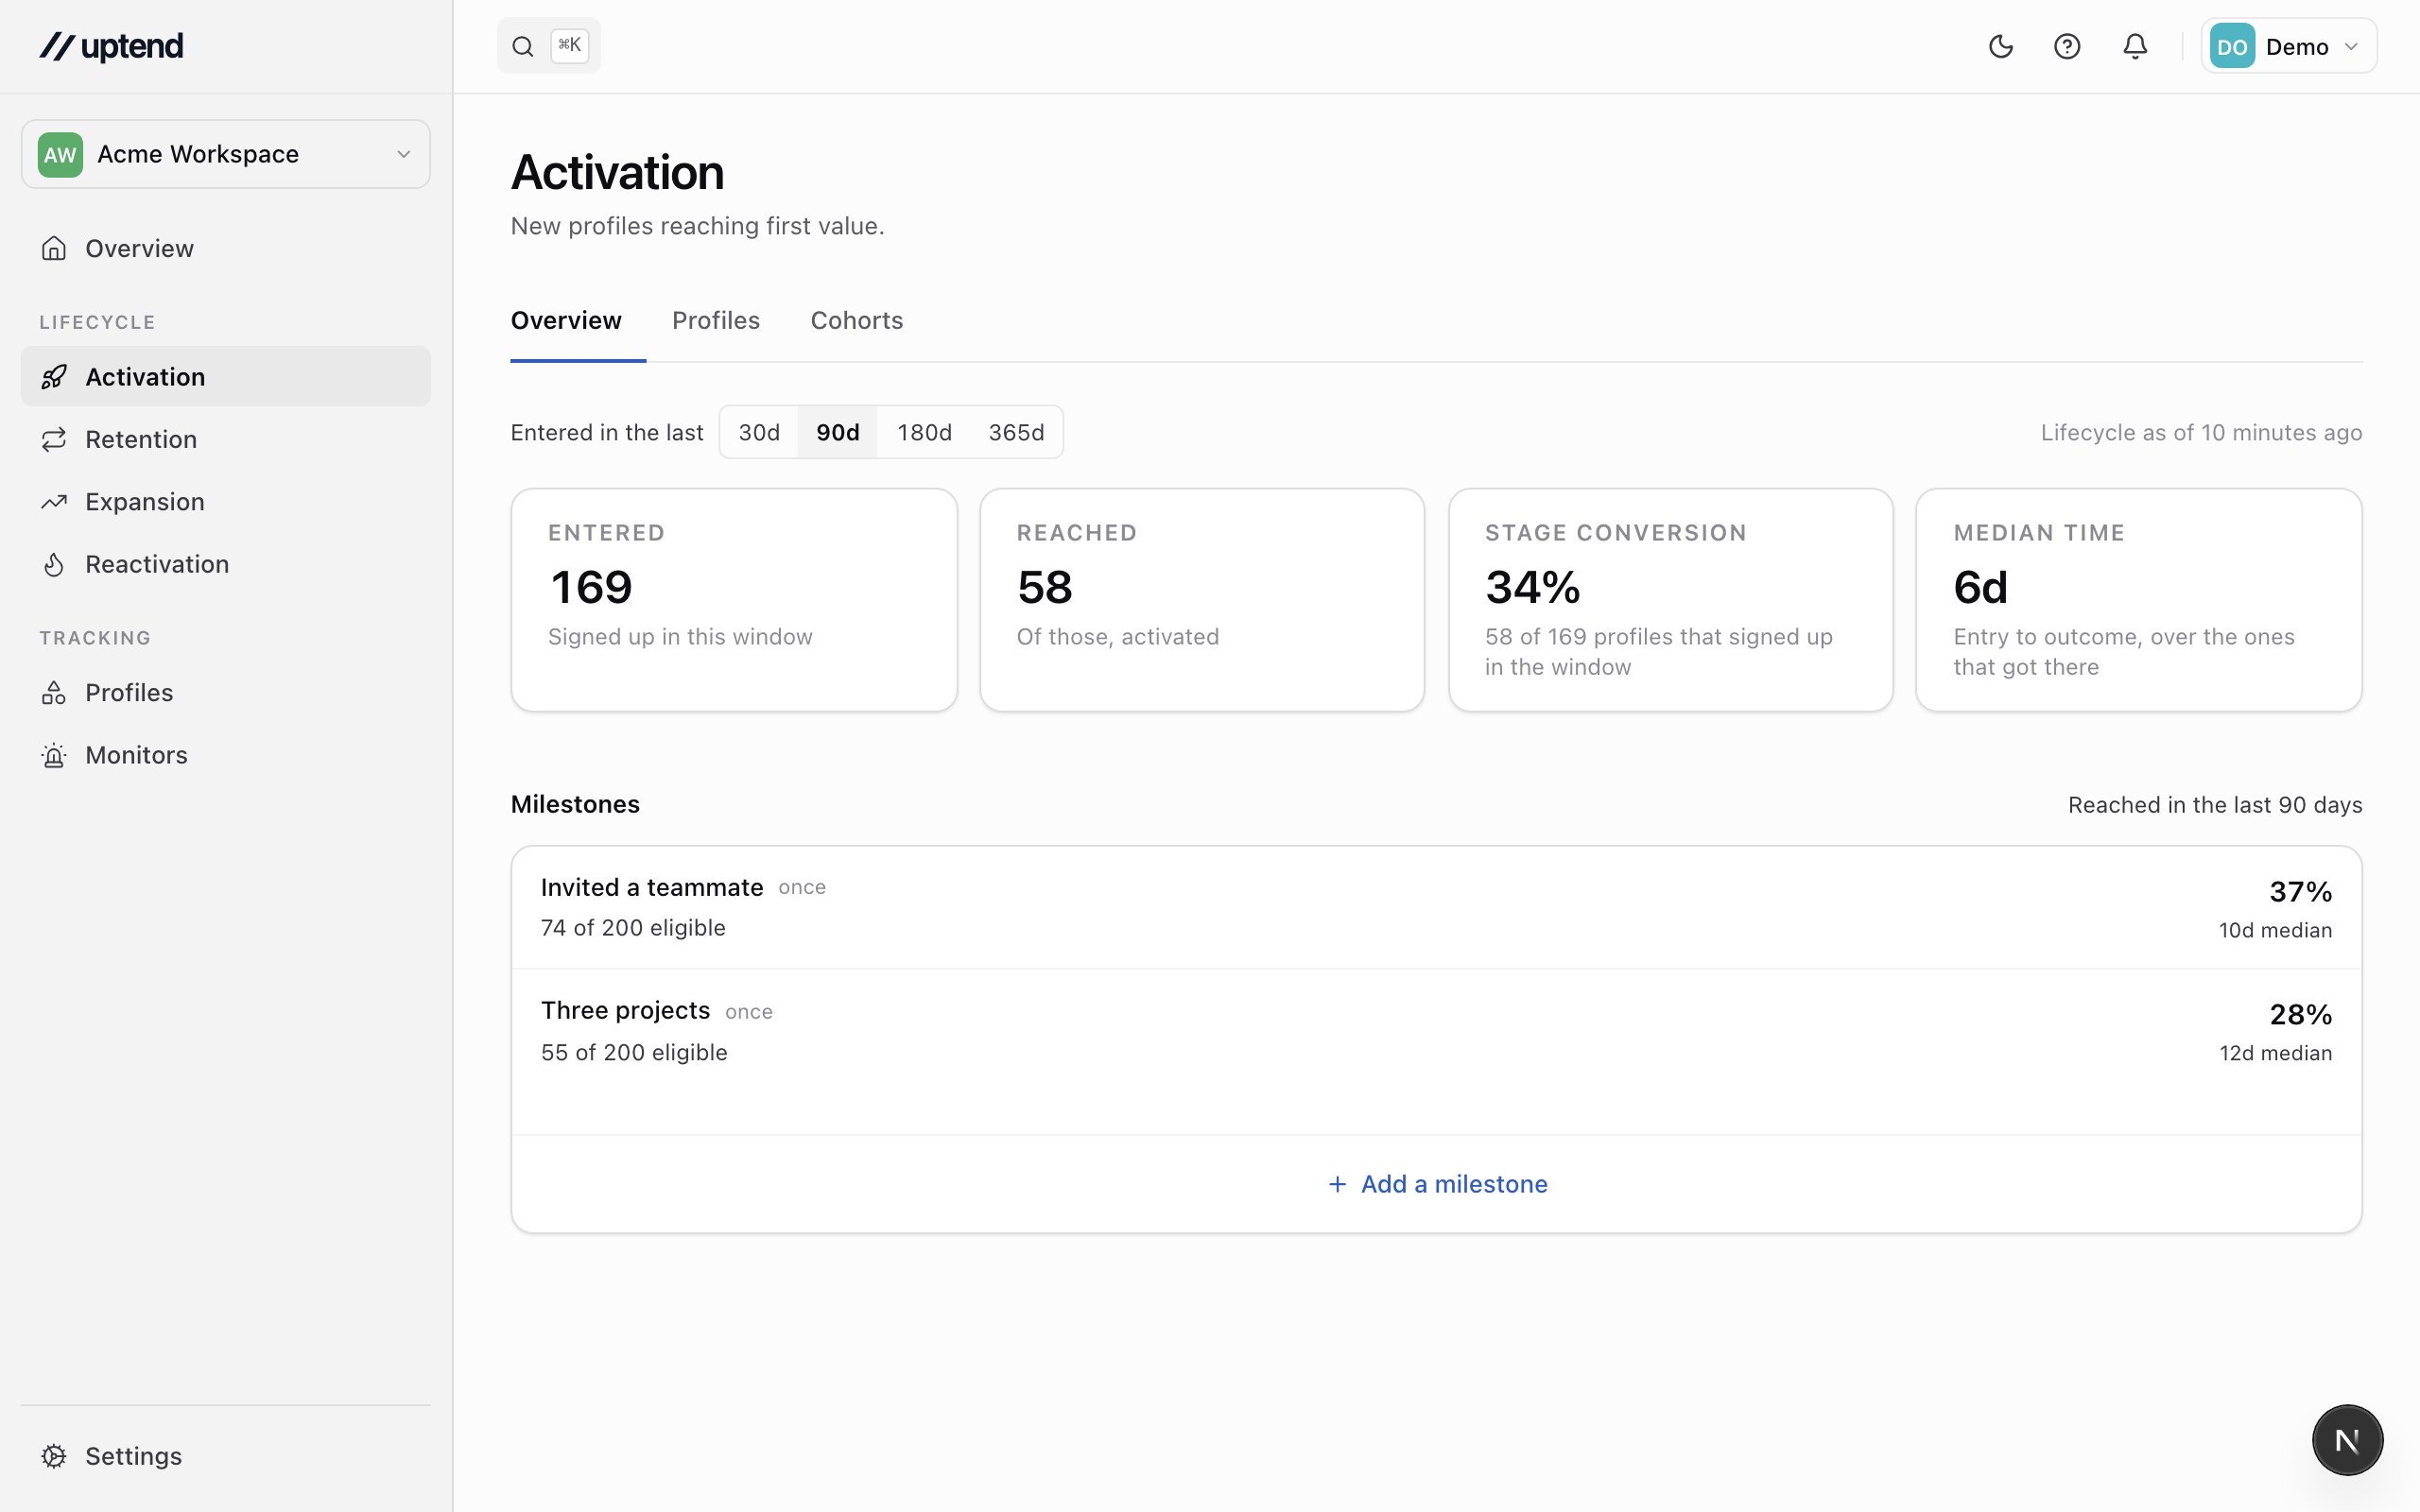
- Overview — the headline numbers: how many entered, how many got there, the rate, and how long it took. Underneath, whatever that stage has its own answer for — Retention's churn and quadrant, Expansion's growth ledger — and its ranked list.
- Signals — what this stage declares it detects: its milestones, each with its own rate, above its monitors and their open counts. This is where you add, edit, pause and promote them; the Overview is left to read the stage.
- Profiles — everyone in the stage right now, ranked by how likely the stage's outcome is and what it would be worth.
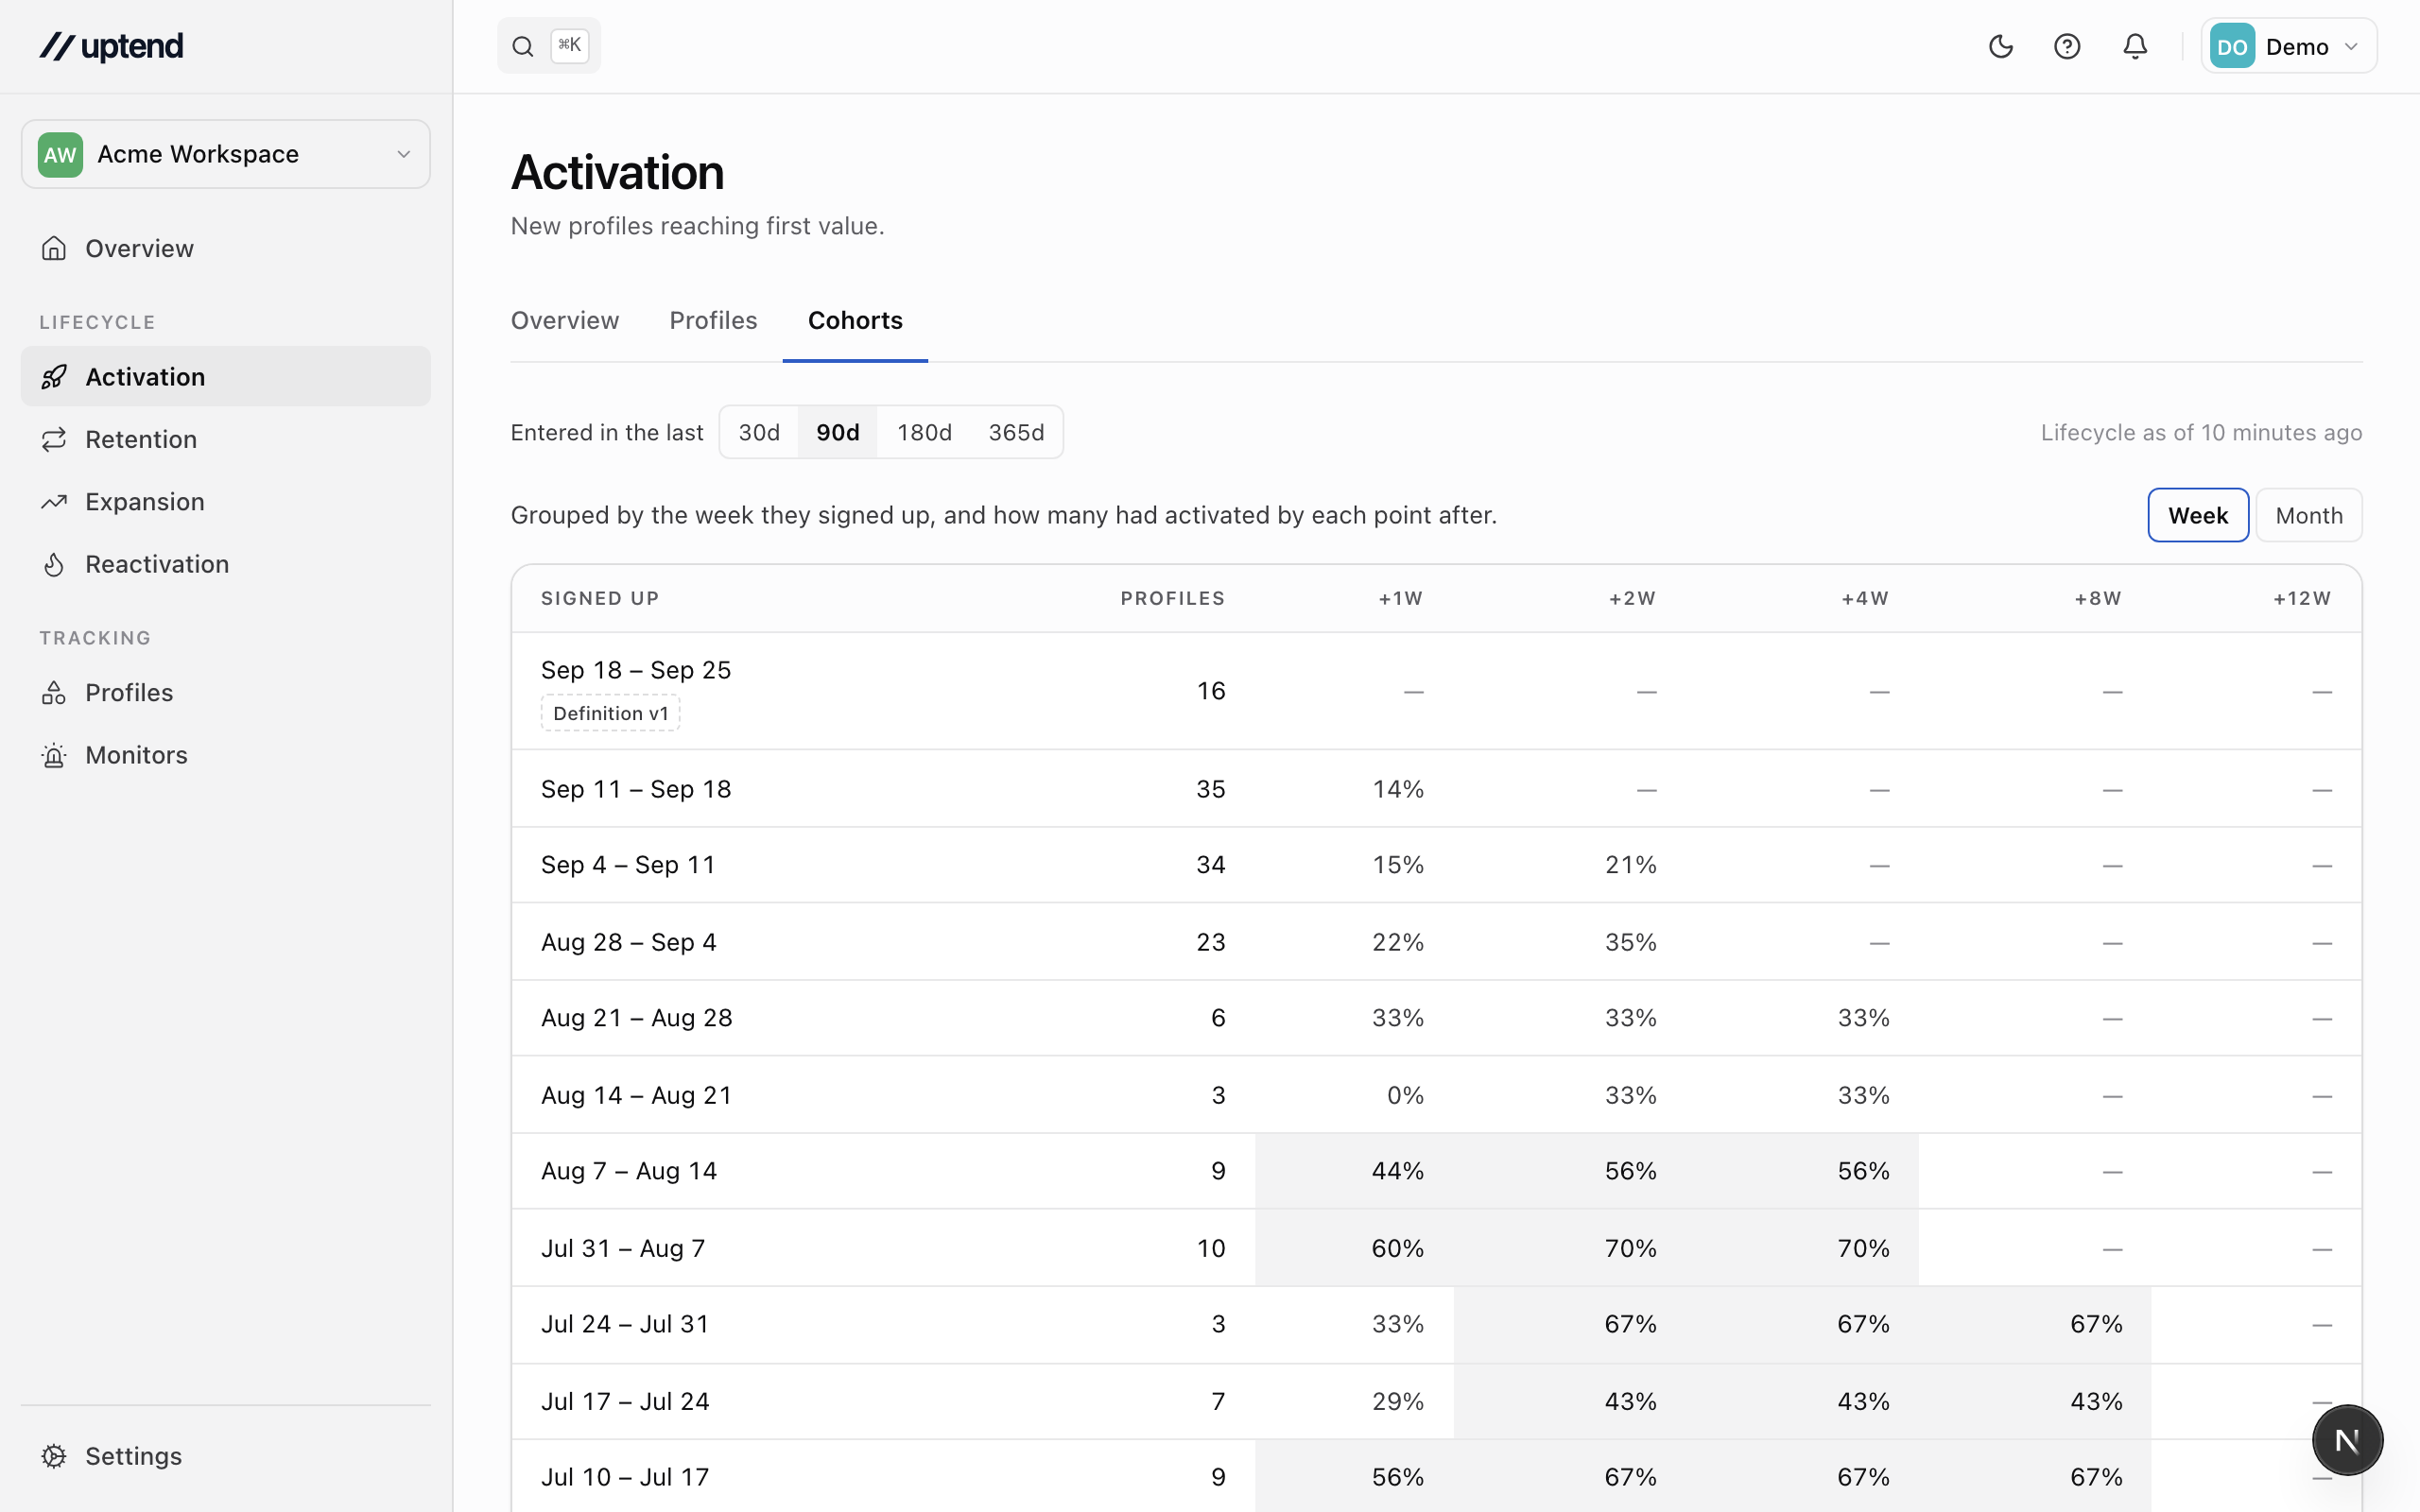
- Cohorts — everyone grouped by when they entered the stage, and how many had reached the outcome by each point after. Buckets are calendar weeks and months in your workspace’s timezone; a cell reading “–” is one we cannot calculate honestly rather than a zero. See Reading a cohort cell.
lifecycle-stage-signals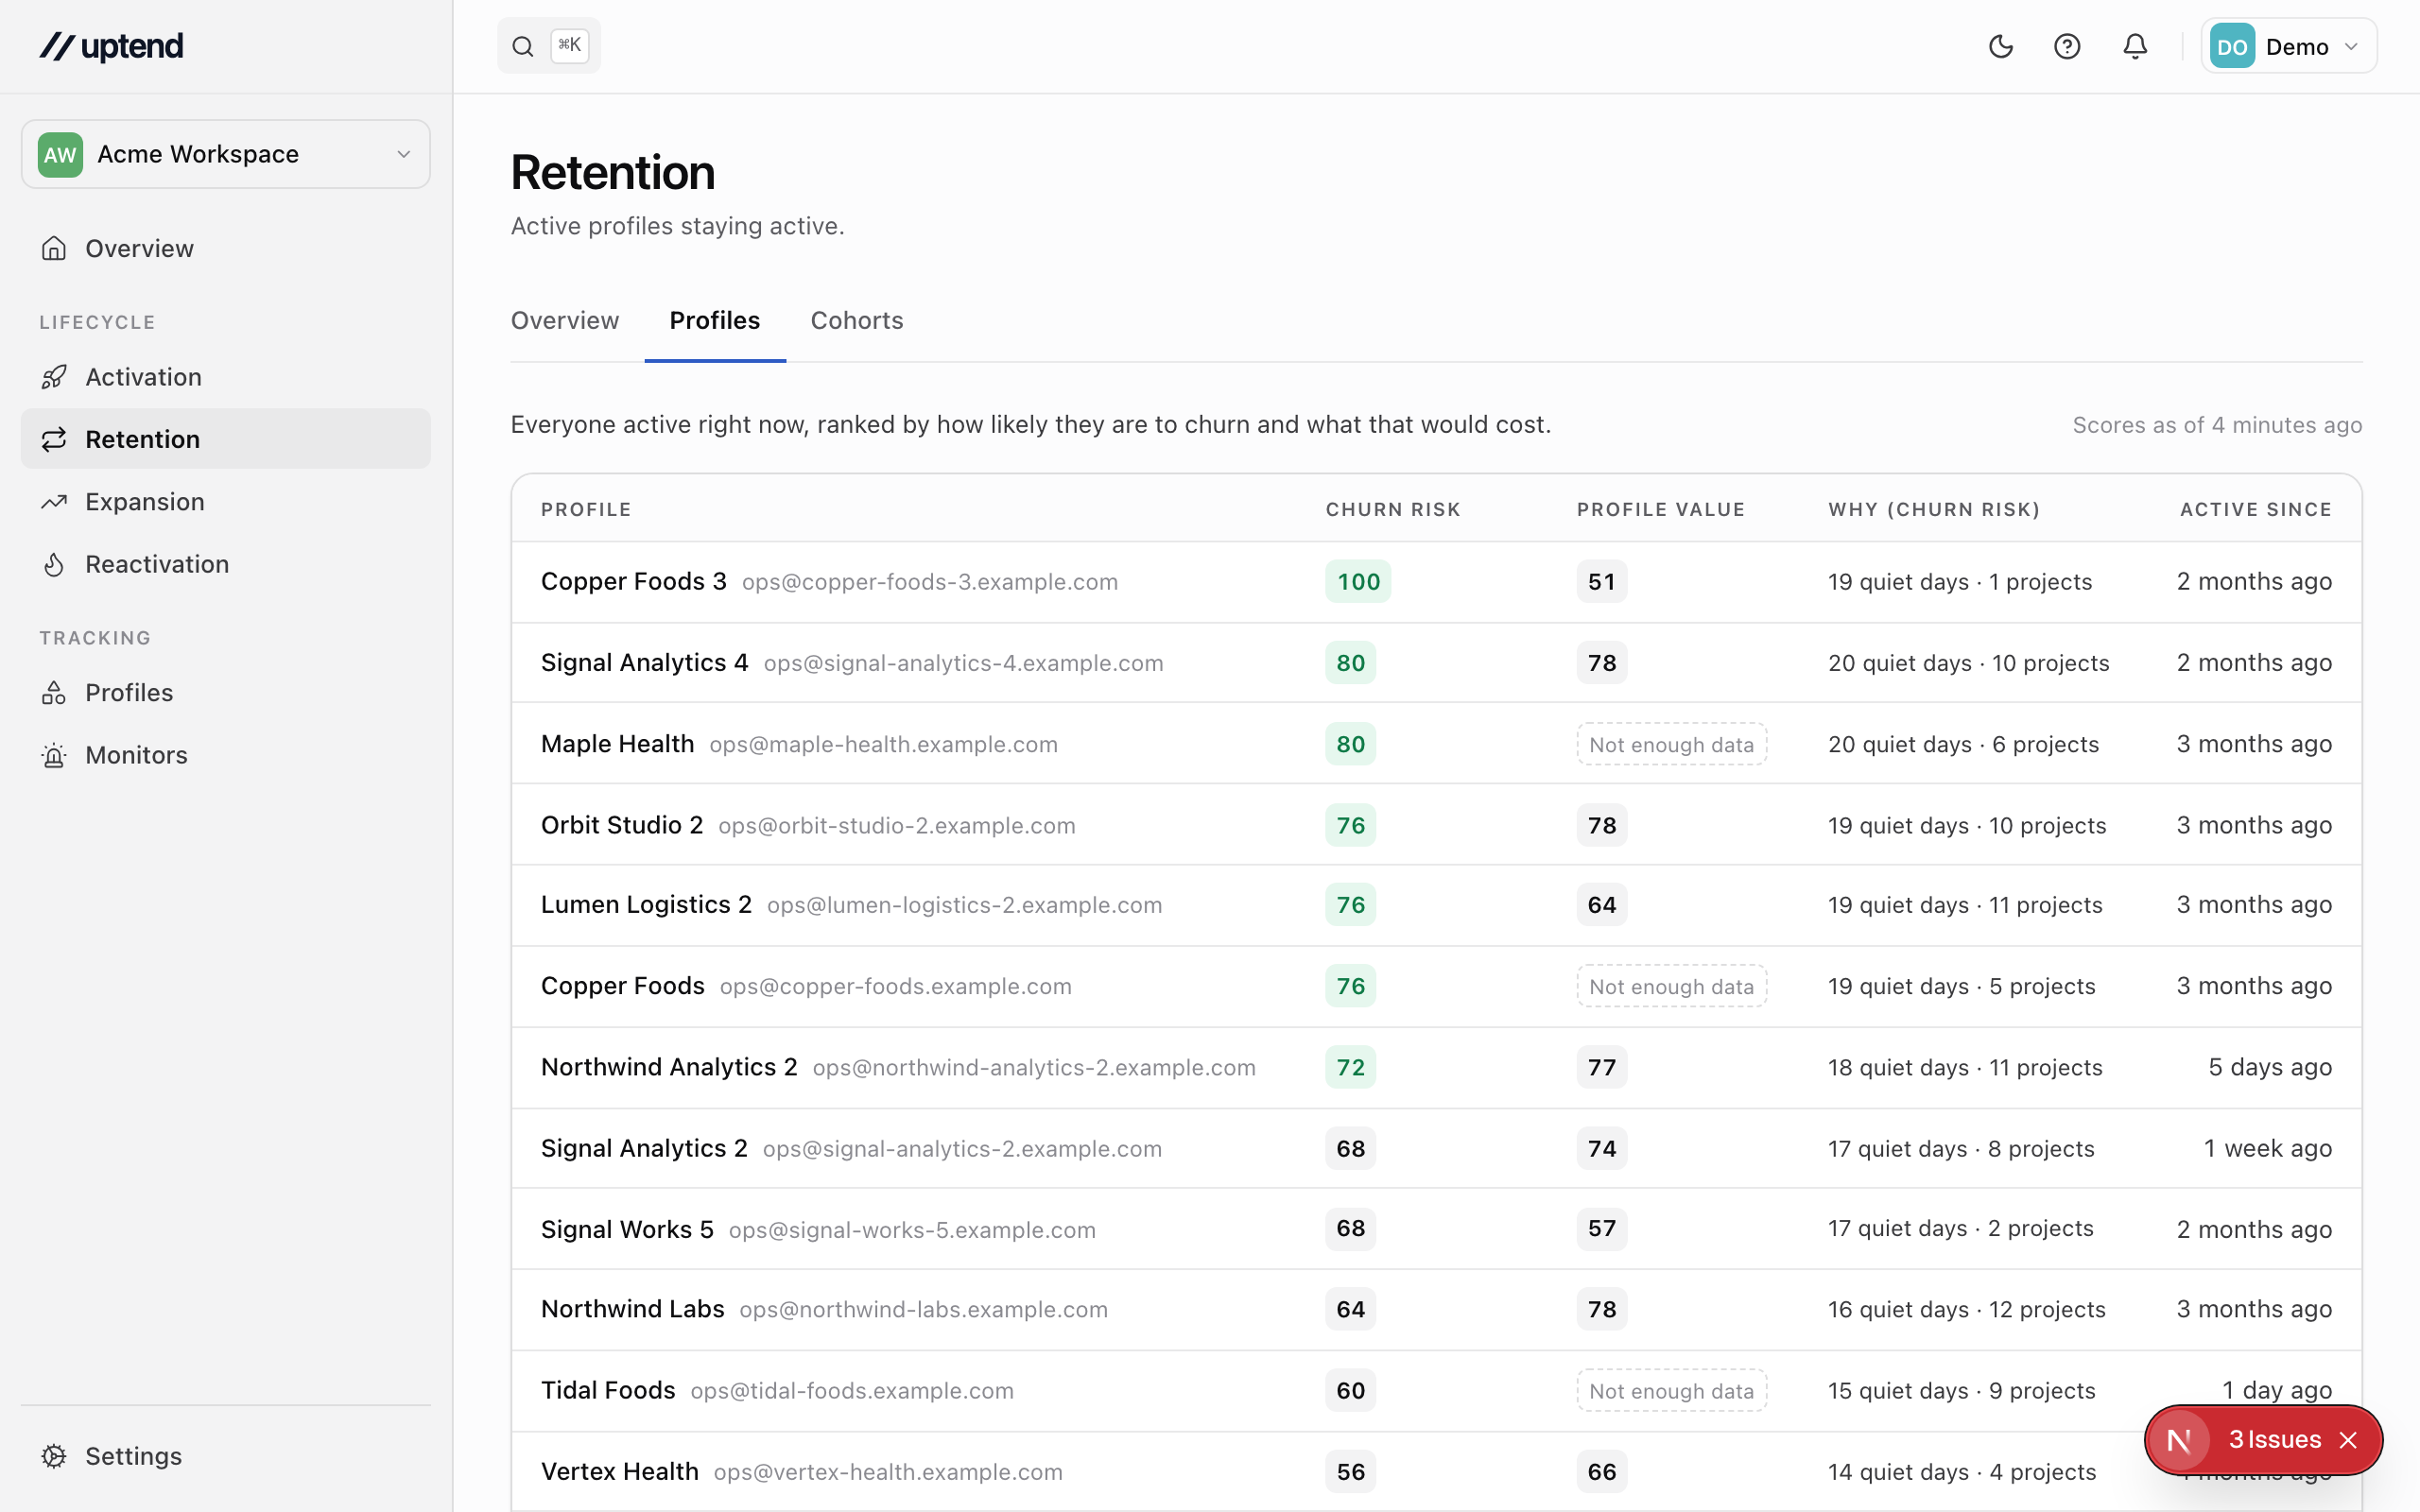
Reading a cohort cell
A dash is not a zero. It means we cannot calculate that rate honestly. Connecting a data source imports everyone at their real signup date, but it cannot tell us when each of them did anything — those timings get filled in from how things look today. Cohorts from before we started watching are marked Not collecting yet: you still see how many profiles are in them, because that part is real, but the rates that describe their history are withheld. This is why a brand-new workspace shows mostly dashes; they fill in as the data arrives.
Whatever we missed, every cohort knows where it stands now, because that is a count of profiles as they are today rather than a claim about when something happened. That cell is the last filled cell in the row — further right for an older cohort than for a younger one — and it reports even when every cell to its left is a dash.
A blank cell is not a withheld one. It means that point in time has not arrived yet: the cohort is too young to have reached that many weeks (or months) past its entry. That is why the table tapers — the step where each row runs out is that cohort's today.
The row you are currently inside is marked In progress, and Lifecycle v2 marks the bucket in which the lifecycle definition changed, so a shift in the numbers has an explanation next to it.
Every view shares one control: Entered in the last 30, 90, 180 or 365 days. It applies to when each profile entered the stage, and travels in the page address, so a link you share shows the same numbers.
Milestones
A stage's conversion rate answers one question — did they get to the end. Milestones answer the rest: what happened along the way, each with its own rate over its own denominator. They are declared per stage and listed on its Overview; a workspace starts with none, because what counts as progress in your product is the one thing we cannot guess. See Milestones.
A milestone is something that sticks, which is why its number is a rate. Its mirror is the monitor, whose number is a count of what is open right now. Whether you want either list full is a separate question you answer per signal — see Good news or bad.
Monitors
Below each stage's milestones is its monitors. A monitor watches for a condition being true of a profile — an import failing, a card expiring in nine days, nobody seen for a fortnight — and trips, resolves and trips again as that condition comes and goes. A monitor tells you something is true of a profile now, where a milestone tells you something happened, permanently. Usually that something is a problem, and you say so with the Is firing good news? setting rather than by choosing a door — a monitor for a trial that is actively converting is one you want full. It is written in the same sheet a milestone is, on the same page, and watches the stage it was written on. See Monitors.
Scores
Every page here asks the same two questions — how much is this profile worth to us, and how likely is this stage's outcome — and there is one score for each answer. Four in all, and every one of them is drawn on an axis somewhere; nothing is computed just to be looked at.
- ICP fit predicts what a profile is worth before it has used anything, from firmographics.
- Profile value observes what it is worth once it has: seats, plan, usage. Fit and value are the same axis with different evidence, and they hand over at the activation milestone.
- Churn risk is how likely an active profile is to leave.
- Expansion readiness is how close it is to growing — which needs a milestone on the Expansion stage to measure against.
Risk and readiness exist only while a profile is active. All four are computed after every evaluation, and which one each chart draws is fixed — see Where a model is drawn.
A score is always shown in one of three ways: a number from 0 to 100 with a band (low, medium, high), Not enough data when the profile is too thin to score fairly, or Not computed when no score has been produced yet. The last two are never treated as a low score, and sorting by a score keeps them grouped after the numbers.
Data as of
Every page carries a line saying when its figures were last computed. Lifecycle states, signals (your milestones and monitors) and scores are recomputed as three passes — after every sync, every six hours in between, and whenever an admin saves the definition, saves a change to a scoring model, or clicks Recompute now — so the line always names the pass the page actually reads. The passes and their results are listed under Settings → Lifecycle.
Enrich profiles
Look up what the outside world says about a profile — whether their site is live, what it's built on, how much they sell — and store it as properties your rules and scores already understand.
Defining the lifecycle
Set the rules that place every profile in a lifecycle state, say what counts as growth, and preview a change before it recomputes.